

 |
 |
 |
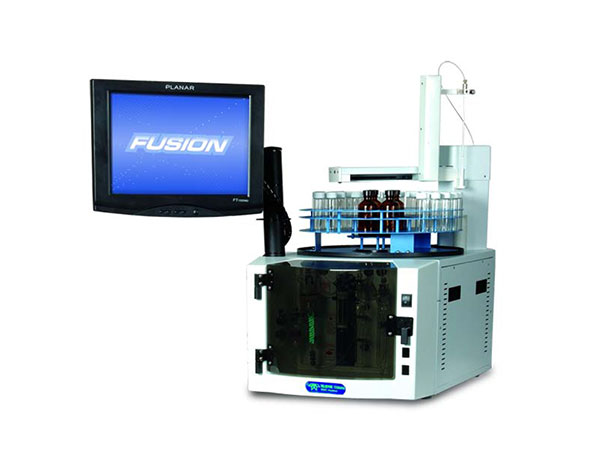
TOC Fusion UV/Persulfate Analyzer Can be low-level detector filter are important features for excellent analyses below 500 ppb.
A Guide for Analyzing Low-Level Total Organic CarbonUsing a UV/ Persulfate Analyzer
Total Organic Carbon (TOC) analysis is a fast and efficient analytical technique that canbe easily implemented in pharmaceutical manufacturing for cleaning validation due to the all-inclusive nature of the test for carbon. It can be used to test for residues of previously manufactured products, cleaning detergents, solvents, by-products, and degradants. Although the current requirement set by the pharmacopeias for instrument performance is at 500 parts per billion (ppb), many pharmaceutical companies regularly test at one-tenth and even one-hundredth that requirement. This paper will discuss guidelines for performing low-level TOC analysis using a UV/ Persulfate analyzer.
Introduction
Understanding the theory and application of instrument calibration is critical to successful operation. In this study, the UV/Persulfate analyzer is configured for low-level analysis using Static Pressure Concentration (SPC) technology (patent pending). SPC technology allows all of the carbon to be concentrated inside a Non Dispersive Infrared (NDIR) detector at a specified pressure setting. Once this setting has been reached and equilibrated, a single absorbance reading of the carbon is made, which correlates to the amount of carbon within the sample.
Experimental - Instrument Conditions
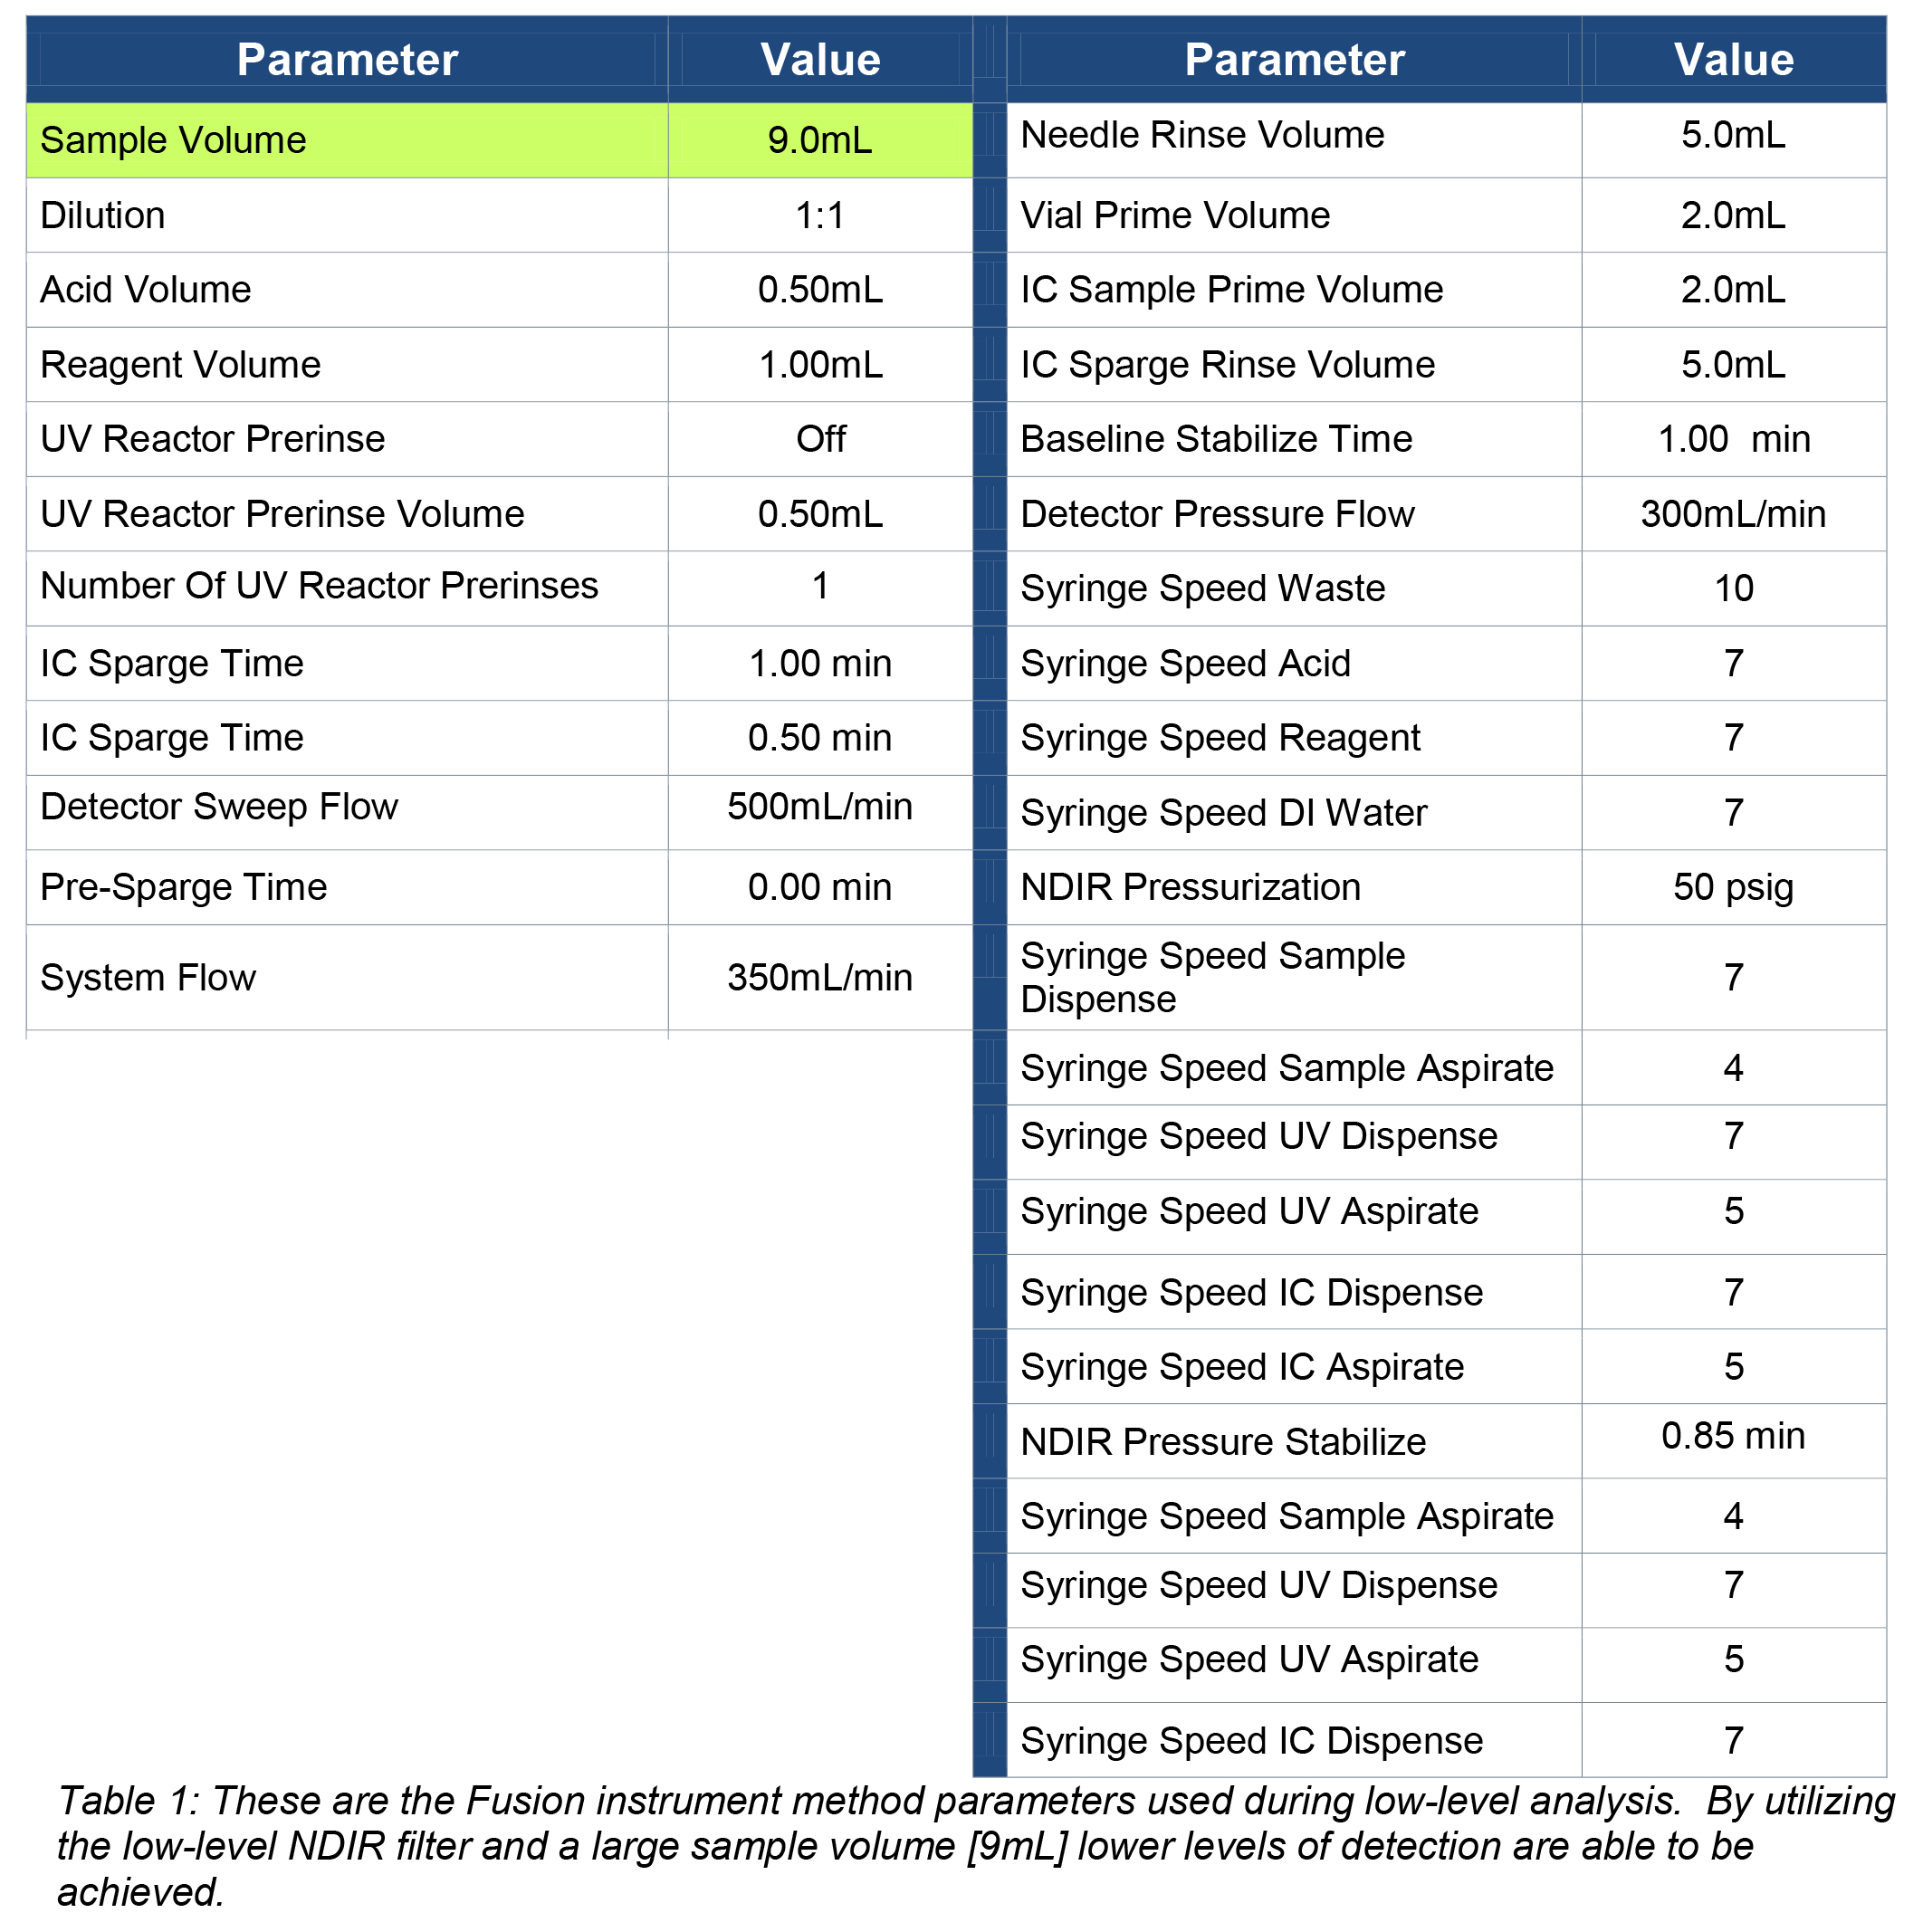
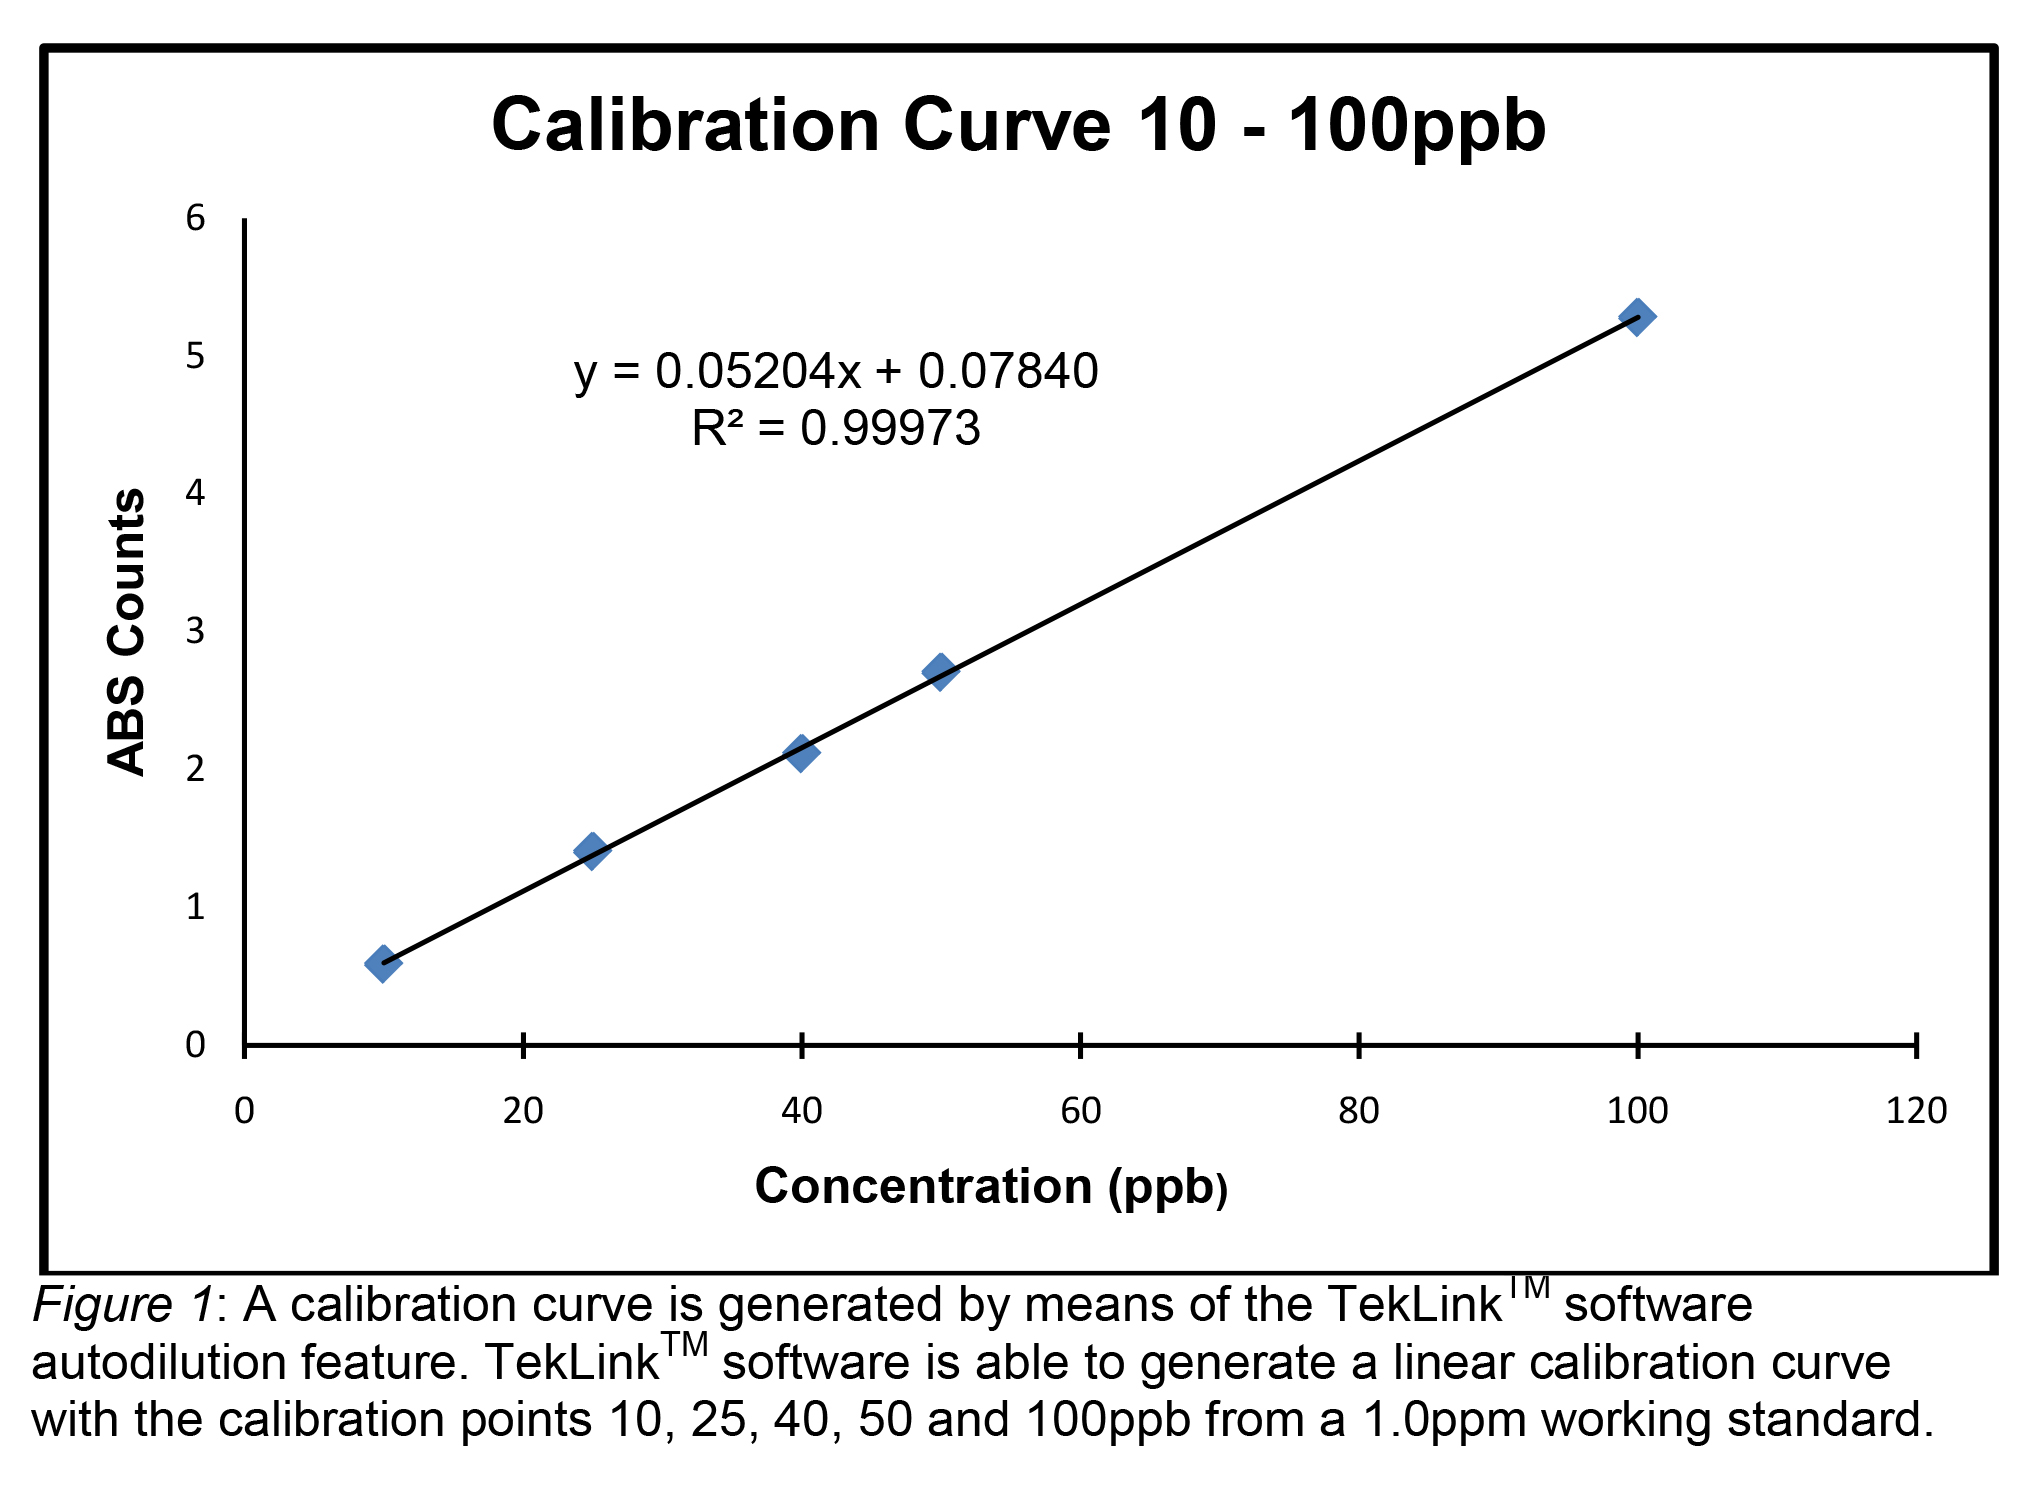
A 1.0mL reagent volume is the most suitable parameter setting for the generation of the calibration curve and subsequent analyses of calibration check standards. A 1.0 part per million (ppm) working standard of Potassium Hydrogen Phthalate (KHP) is made by serial dilution from a 1000ppm KHP stock standard. The 1.0ppm working standard is used to generate the calibration curve by the autodilution feature of TekLinkTM software.
The method parameters used to generate the calibration curve are depicted in Table 1. The resulting calibration curve is in Figure 1. A 9mL sample volume and the use of the low-level NDIR filter are critical method parameters to perform analyses below 1.0ppm.
Sample Analysis
Benefits/ Conclusion
As mentioned earlier, the world pharmacopoeias have set the minimum standard for instrument qualification at 0.500ppm. However, the need for low-level analysis coincides with the increasing sensitivity of instruments and the demand for high-purity water. This demand for lower levels of analyses has shown up as people are increasingly moving from the parts per million to the parts per billion level for TOC sample analyses on bench-top analyzers.
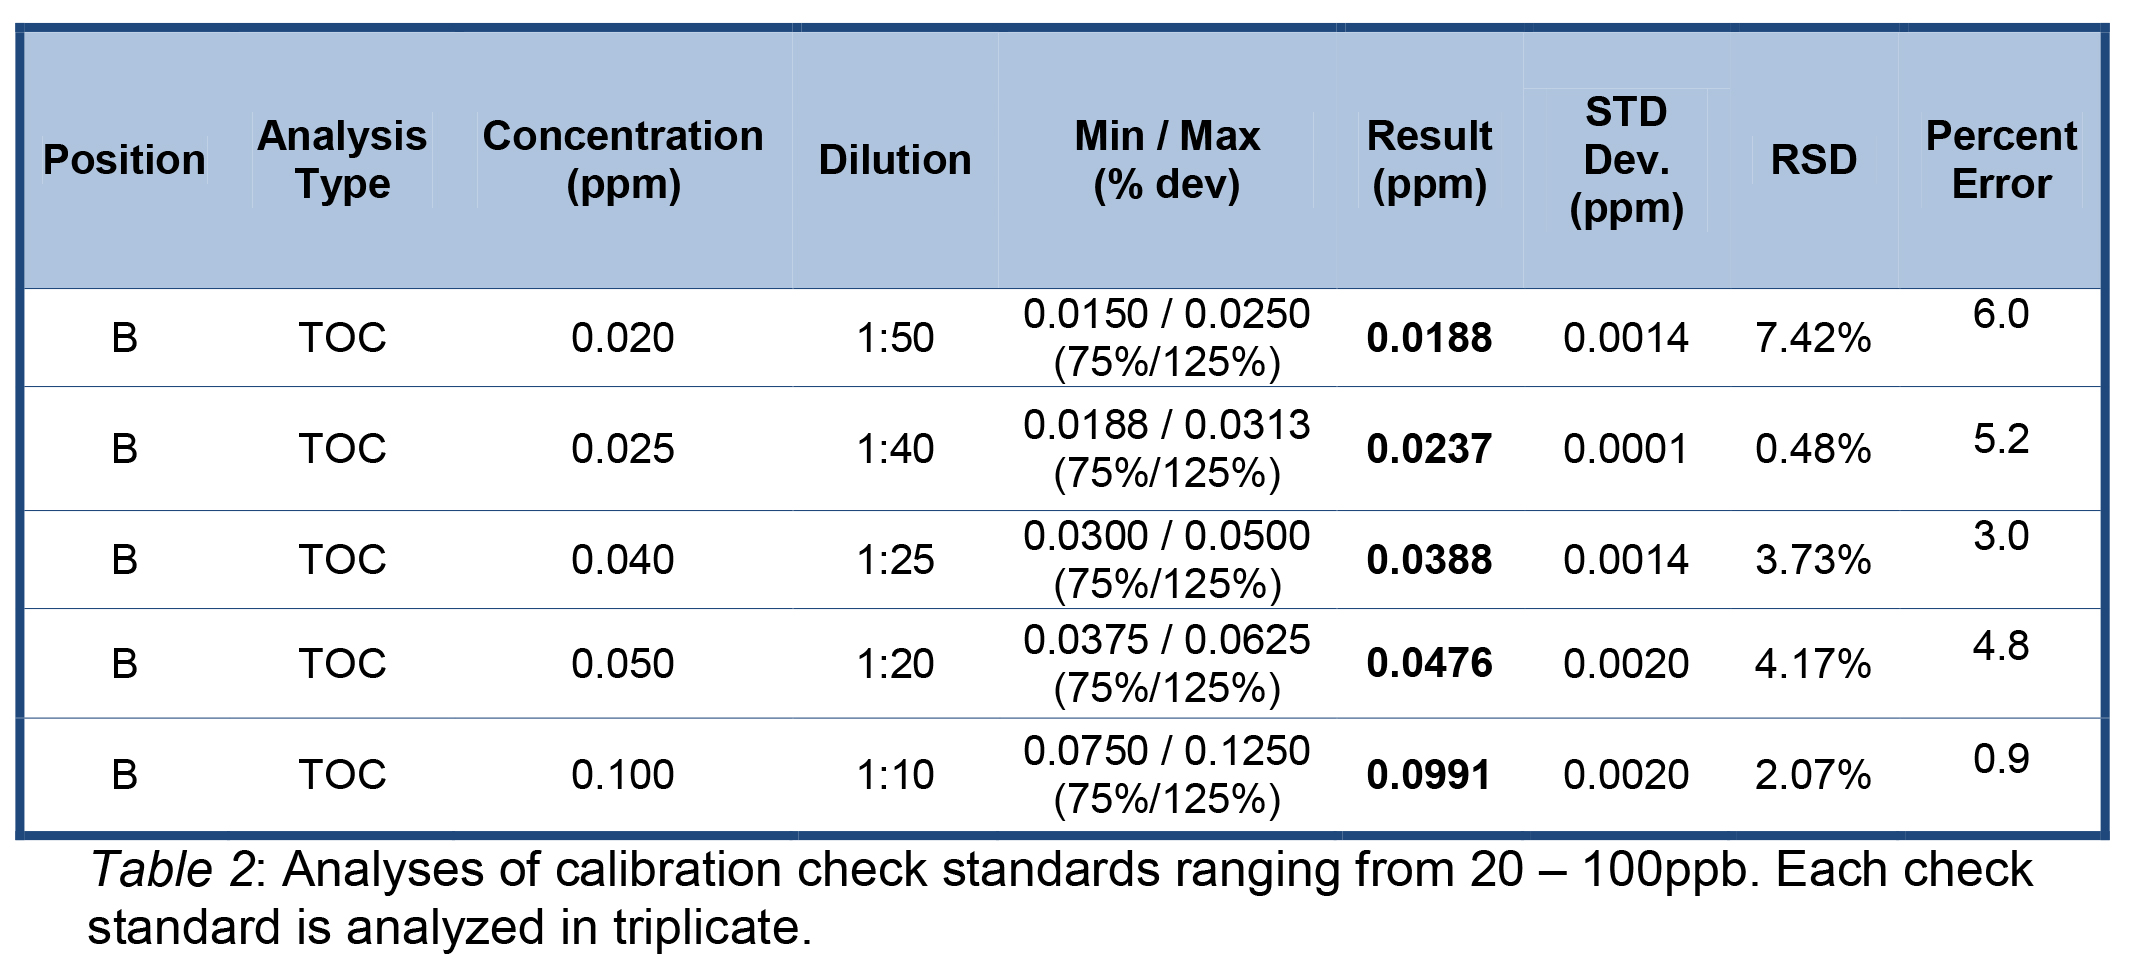
The use of SPC technology detection enhances the ability to analyze below the current standard USP 500ppb level. The calibration curve efficiency is evaluated through analyzing low-level points as check standards using the automated dilution feature of the TekLinkTM software. As shown in Table 2, the Fusion performed very well on all calibration curves for linearity and precision. The standard deviations of 2ppb or less on all calibration check standards and low percent errors are another indication of excellent accuracy and precision of the Fusion.
The TOC Fusion UV/ Persulfate Analyzer has a combined instrument and autosampler platform, autodilution of standards and samples using TekLinkTM software, and SPC technology. All of these features combined with a sample injection volume of 9.0mL and the use of the low-level detector filter are important features for excellent analyses below 500ppb.
Credit : Teledyne Tekmar


|
|
|