

 |
 |
 |
FT-IR allows the analysis of large multilayer areas as well as the detection of smallest structures, defects and contaminations
Introduction
The analysis of different kinds of multi-layer systems is of considerable interest in various industries. Particularly, the spatial distribution of specific substances, particles and defects needs to be measured in order to gain information about all kinds of material properties. Of interest are typically the chemical composition of different layers or the distribution and size of embedded particles resulting from pigments, fillers or impurities. The Bruker FT-IR microscope series HYPERION allows the analysis of large multilayer areas as well as the detection of smallest structures, defects and contaminations. HYPERION FT-IR microscopes offer the highest possible optical resolution which is only limited by the diffraction of light. With the dedicated OPUS software Bruker offers a powerful tool for measurement, evaluation and visualization of microscopy samples.
Instrumentation
The HYPERION FT-IR microscope series represents the most advanced level of FT-IR microscopy available today, utilizing state-of-the-art optics for optimal sample visualization and infrared data collection. Even at the highest spatial resolution the HYPERION microscopes exhibit an outstanding sensitivity. The innovative attenuated total reflectance (ATR) objective is equipped with a very precise internal pressure sensor and can also be used as a 20 x visual objective. Due to the special design of this objective it is possible to analyze even structured samples by automated ATRmapping. Thin coatings on substrates, monolayers, surface contaminations and oxidation layers can be measured on reflective substrates with excellent sensitivity by means of the grazing angle objective. Furthermore the HYPERION microscopes can be equipped with a focal plane array (FPA) detector for spectral imaging that allows to record up to 16.384 spectra simultaneously.
Example measurement
As an example the analysis of a multi-layered paint chip is shown. The sample was embedded in a resin, cut and polished. It was analyzed with a Bruker HYPERION microscope. (Figure 1).
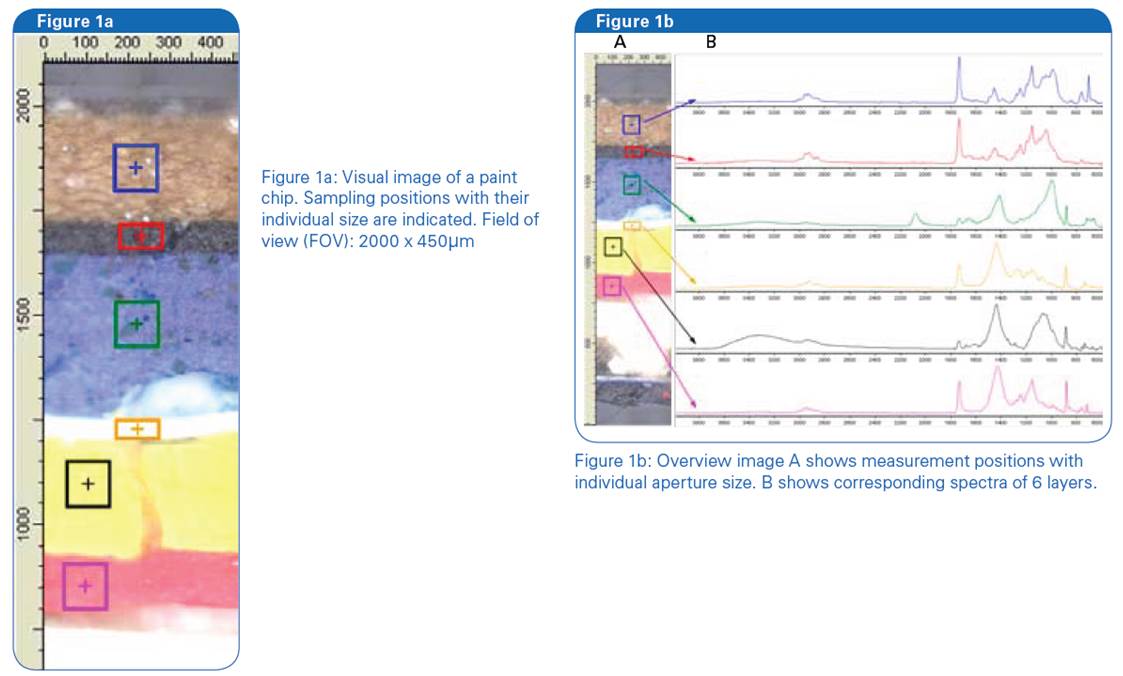
ATR mapping measurements were performed using an 20 x ATR-objective in combination with a motorized sample stage. Measurement positions and sampling areas were set specifically for each layer. An acquisition time of 14 sec at a spectral resolution of 4cm-1 was used. During the infrared measurement, the sample is brought into contact with the tip of the Germanium (Ge) crystal (100μm in diameter) of the ATR-objective on all predefined sampling positions. The effective field of view at all sampling positions is adjusted automatically by an motorized aperture. Figure 1b shows the visual image with the corresponding spectra of the upper 6 layers of the paint chip (the top layer is resin).
ATR imaging of a specific layer of the paint chip
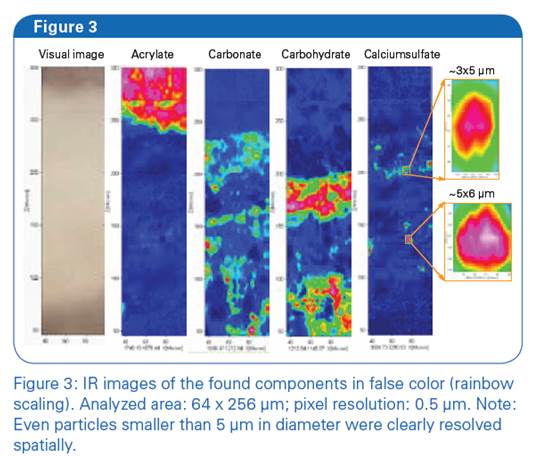
In the multilayer sample (Figure 1b) a wider white area is visible below the red layer. To determine whether this distinct layer includes only one component or if several constituents are included the ATR imaging technique was used. This state-of-the-art technique uses a focal plane array detector (FPA) with 64 x 64 pixels in combination with a 20 x ATR-objective. With this approach a pixel resolution of 0.5μm is achieved. Each pixel of the FPA detector collects a complete FT-IR spectrum. A measurement area of 32 x 32μm is covered and 4096 spectra are recorded simultaneously. By combining “imaging” and “mapping” a multitude of single images can be merged automatically into a larger image with high resolution.
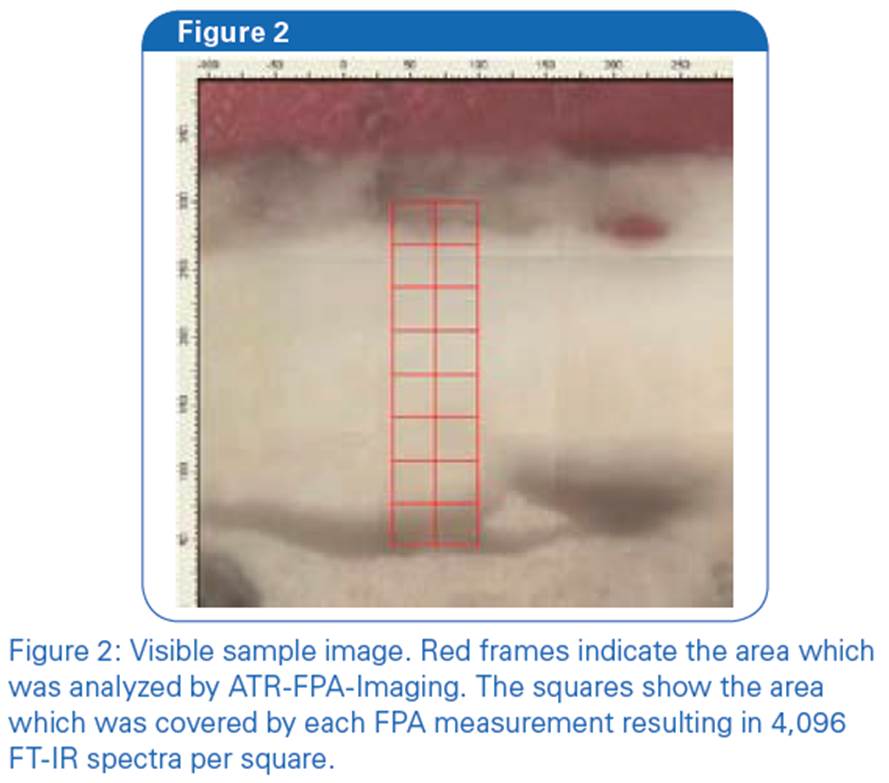
The analysis was performed by mapping an area of 2 x 8 images which results in a field of view (FOV) of 64 x 256μm. Figure 2 shows the visual image of the white layer from the multilayer. 65,000 spectra (2 x 8 x 4096 Spectra) at a spectral resolution of 8cm-1 were recorded in about 10min. In order to visualize these spectra, the intensities of suitable absorption bands – characteristic for certain functional groups – were plotted in false color over the analyzed area. The resulting IR images show high concentrations of the found components in red and low concentrations in blue (rainbow scaling; Figure 3). Contrary to the low visual contrast these IR images reveal clearly the chemical complexity of this layer and the inhomogeneous distribution of all the components. Besides the acrylate other substances like carbonates, carbohydrates and calciumsulfate are present. The smallest particles detected within this layer are from calciumsulfate with less than 5μm in diameter.
Polymer laminates in transmission
High resolution IR images can also be collected in transmission if the sample is transparent in this spectral range. The advantage of this method is a contact-free measurement.
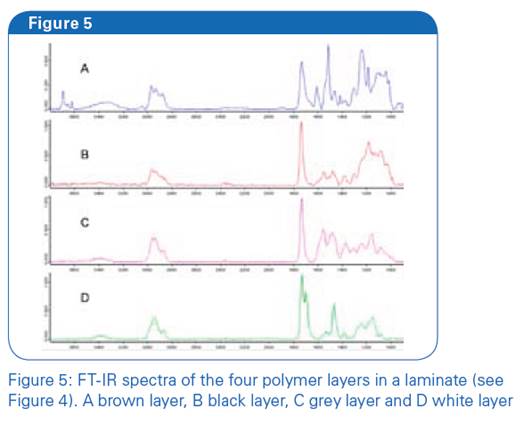
As an example a 4 layered polymer laminate (microtom section of 10μm) was analyzed (Figure 4). By using the 15 x objective a transmission-image with a FOV of 170 x 170μm and a pixel resolution of 2.7μm was obtained. To acquire the full width of the sample a 2 x 2 image-map with a FOV of 340 x 340μm was measured. The total acquisition time was 3min at a spectral resolution of 4cm-1. In Figure 5 representative pixelspectra are shown, indicating characteristic absorption features of the four layers.
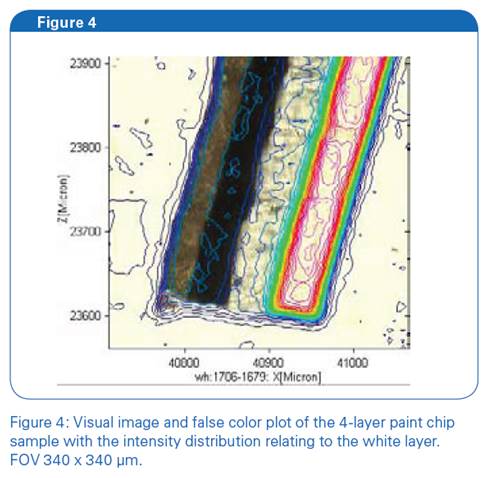
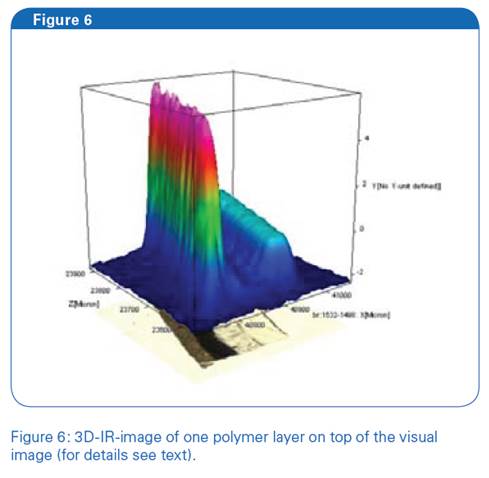
IR images were generated by plotting the intensities for those characteristic absorption bands above the analyzed sample area. Figure 4 displays the IR image of one included polymer as a false color plot in 2D (“contour plot”). This perspective is very suitable to correlate structures in the visible with those in the IR image. The OPUS software offers a wide range of display and visualization functions. Figure 6 shows the IR Image of an absorption band correlated to one polymer in 3D on top of the visual image of the sample.
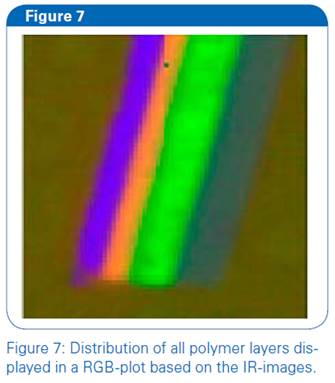
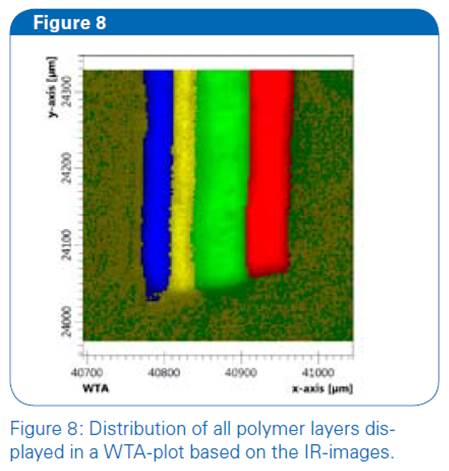
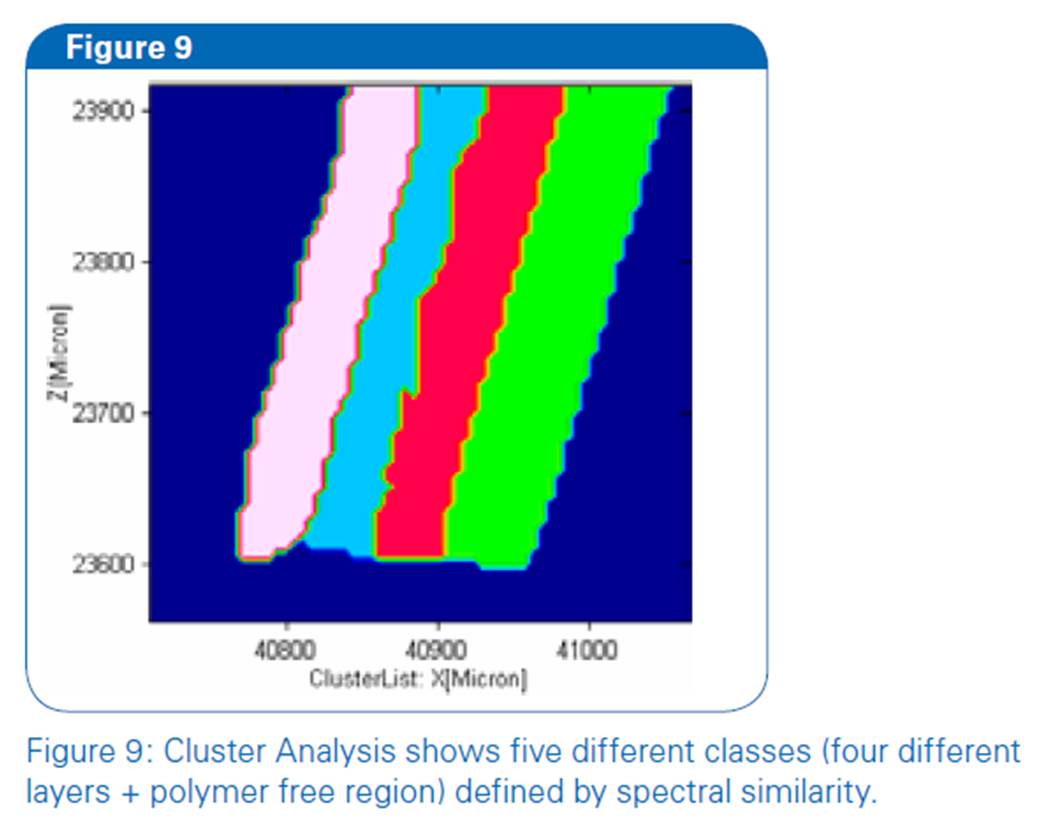
Single spectra from any position of the acquired image can be further used for identification purposes e.g. via a library search. To combine information from several IR images, both RGB (Red-Green-Blue, Figure 7) and WTA (Winnertakes- it-all, Figure 8) images can be created. In an RGB picture up to three sample components are assigned to RGB colors that are merged at each image pixel. The WTAmodel assigns the color of the dominant component to each individual image pixel thereby allowing to display more than three components in one picture. 3D cluster analysis can be performed to evaluate FT-IR imaging data by unsupervised algorithms. The user has to define the number of components in the sample. All individual spectra are grouped into this predefined number of classes according to their spectral similarity (using Euclidian distance or Principal Component Analysis (PCA).
Summary
These results demonstrate that FT-IR-mapping and imaging are powerful, flexible and fast technologies for the characterization of multilayer samples. The IR-imaging is able to show structures in a sample that are completely invisible in the visible image. Additionally, it is even possible to identify the detected substances by means of the library search function. To achieve highest spatial resolution modern focal plane array detector technology can be used resulting in pixel resolutions down to 0.5μm. The combination of IR-imaging and mapping allows to measure large areas up to several mm in size. For the evaluation of the acquired data the Bruker OPUS software offers a wide range of tools. This ranges from single band integrations to advanced multivariate methods like multilinear regression, 3D-cluster analysis and principal component analysis (PCA). Data can further be visualized in multiple 2D and 3D plots, different color schemes, overlay of VIS and IR-images as well as RGB and WTA-Images.
Credit : Bruker Co., Ltd.


|
|
|