

 |
 |
 |
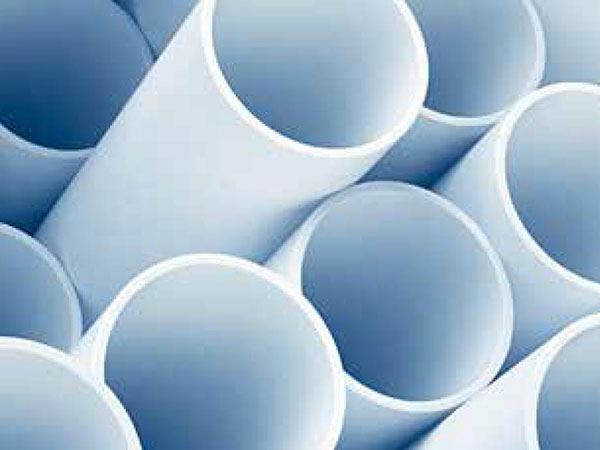
The crystallinity of polyethylene (PE) determines the stiffness, the impact and tensile strength
The crystallinity of polyethylene (PE) determines the stiffness, the impact and tensile strength, the permeability and the resistance of the material. Therefore, its measurement is of paramount importance regarding the specifications of a PE grade. Bruker’s PE crystallinity application provides this information fast, with high precision and repeatability. Other commonly employed methods such as Differential Scanning Calorimetry (DSC) or density determination by displacement are significantly slower and require tedious sample preparation. The analysis can be carried out at line by untrained personnel requiring no dedicated lab environment.
The obtained crystallinity correlates to the density measured with:
Features and Benefts
Applicable to all PEs
Application
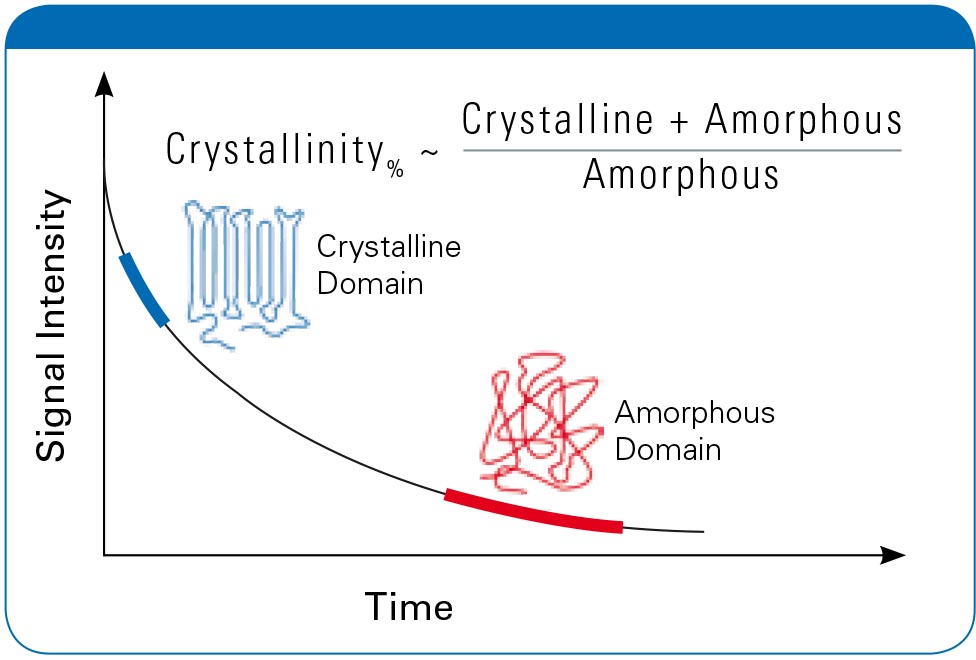
The application Crystallinity of PE is based on the different relaxation times in the crystalline and amorphous domains of the polymer. Protons in crystalline or rigid\ domains return significantly faster to the equilibrium state than protons in mobile domains. Measuring the decay signal at two characteristic times provides a ratio which corresponds to the samples crystallinity.
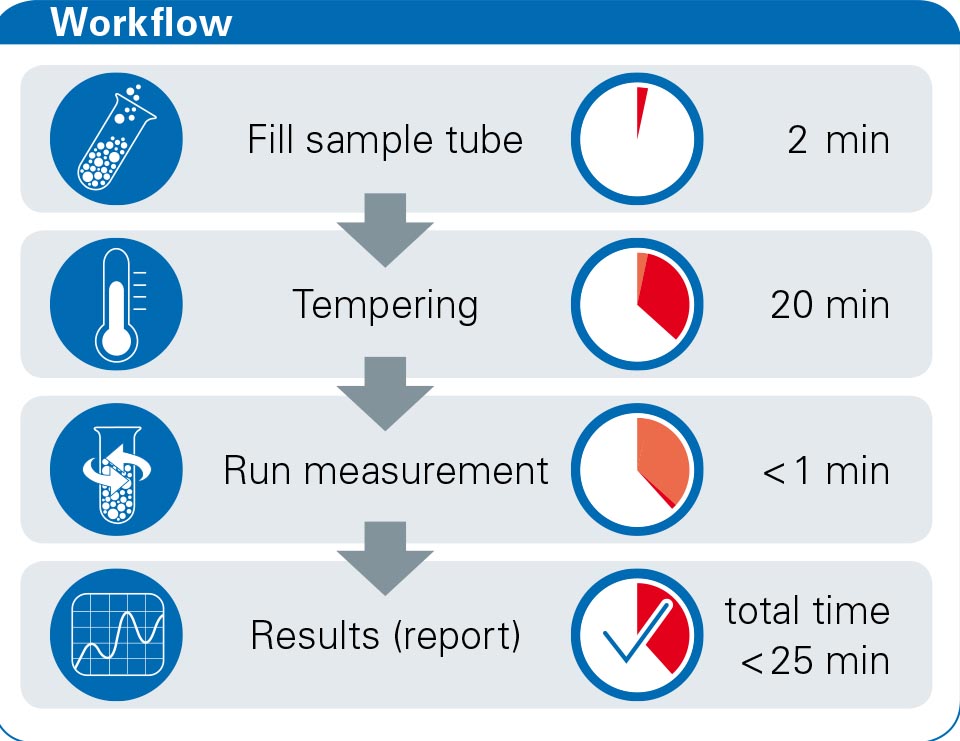
Measurement
Calibration
The method is calibrated with 3 to 5 samples of known crystallinity. NMR values (ratios) are related to crystallinity and/or density by linear regression Bruker-certified standard samples are provided for back-up calibration.
Recommended Equipment
Beyond Quality Control

Credit: Bruker


|
|
|