

 |
 |
 |
The ALPHA based method is a very effective approach for the fast screening of waste water samples
Introduction
During the oil production process on off-shore platforms large amounts of waste water are accumulated. In order to assure an environmentally safe waste dump the quality of the waste water is regulated by law. Therefore specia parameters like the total hydrocarbon content have to be determined. The current standard measurement technique is based on the gas-chromatography (GC)-analysis of a pentane extract of the waste water. Due to the fact that pentane is highly flammable and forms explosive gas-air mixtures, it´s not advisable to be used on oil platforms. Hence the waste water sample needs to be transferred to a mainland lab by helicopter. Obviously this form of water analysis is very costly and time consuming. As an alternative to this GC-based measurement procedure, FT-IR based methods have already been established and used. Their mayor drawback is the need of C-H free extraction solvents like carbon tetrachloride (CCl4) or tetrachloroethylene (C2Cl4).
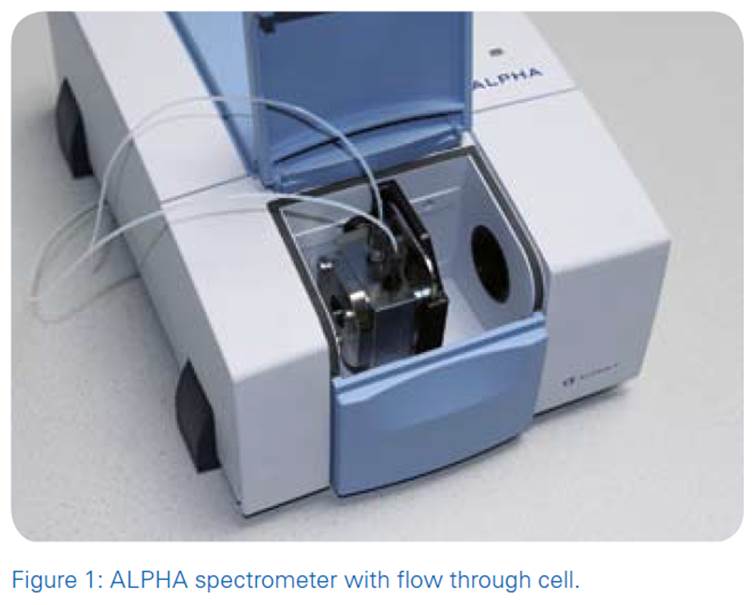
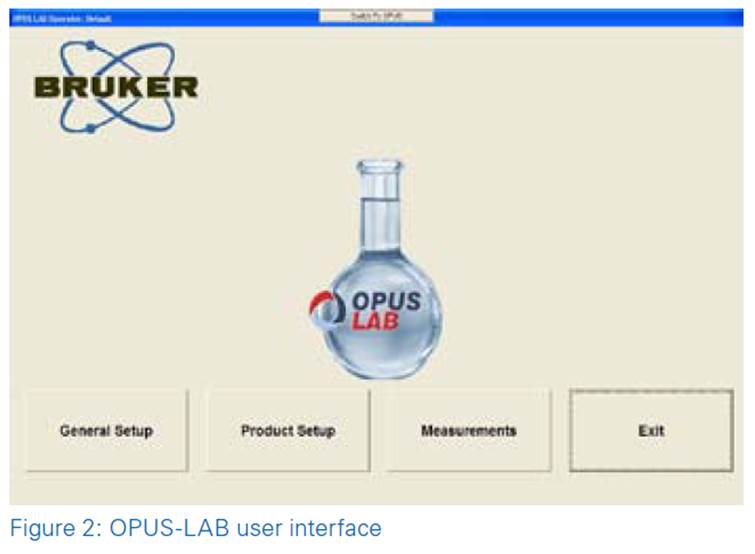
In contrast the ALPHA based method is a very effective approach for the fast screening of waste water samples, however it does not replace the OSPAR GC-based method when official results are required. It uses a simple extraction method with a small amount of the less harmful solvent chloroform. Since the chloroform extraction is notprone to emulsification as is the case with pentane, there is no need to add salt or to centrifuge the extract. With the exception of a filtration using a disposable syringe filter, there is actually no need for a further treatment of the extract. Subsequent to this easy step, the extract can be measured directly at the oil platform with an ALPHA spectrometer in combination with a liquid flow through cell. Compared to the GC-analysis it’s not necessary to transport the sample to a mainland lab and therefore the measurement procedure is very fast and cheap. The complete test including sample preparation, measurement and analysis takes less than 10 minutes. When using the intuitive and easy to use OPUS-LAB software even an untrained person is able to get reliable results immediately.
Instrumentation
The very compact and robust ALPHA FT-IR spectrometer has proven to be very suitable for routine applications. The samples are measured by means of a special designed liquid flow through cell. With the aid of multivariate “Quant 2” calibrations it is possible to measure hydrocarbons in chloroform despite the fact that chloroform itself has C-H absorbances. This approach allows a very accurate determination of the hydrocarbon content with a typical error of prediction in the range of 2 3 ppm. As an additional benefit the OPUS-LAB based user interface provides a very intuitive and comfortable way to perform the IR analysis procedure.
The ALPHA FT-IR spectrometer produces reliable data. A permanent online diagnostics of the spectrometer by the PerformanceGuardTM provides a “real time” display of the instrument status. Instrument validation (OQ/PQ) is performed by fully automated test routines to ensure permanent instrument operation within specification. The OPUS software is fully compliant to cGMP and 21 CFR part 11 when operated in a validated environment.
Example application
The procedure to determine the content of hydrocarbons in a waste water sample comprises essentially two steps: Sample extraction and measurement of the resulting extract with the ALPHA FT-IR spectrometer. Evaluation and documentation of the results is done automatically by means of the OPUS-LAB software. The uncomplicated procedure to analyze the waste water is as follows:
At the sampling point make sure to let the water flow for one minute before you take the sample, then take a water sample of one liter waste water.
Add 50 ml of chloroform to the water sample and shake for 5 minutes.
Separate the organic chloroform phase by using a separation funnel.
Flush the organic phase through a disposable syringe filter into the flow through cell.
The measurement itself is extremely easy:
Click on “Measurements”, then on “Start”.
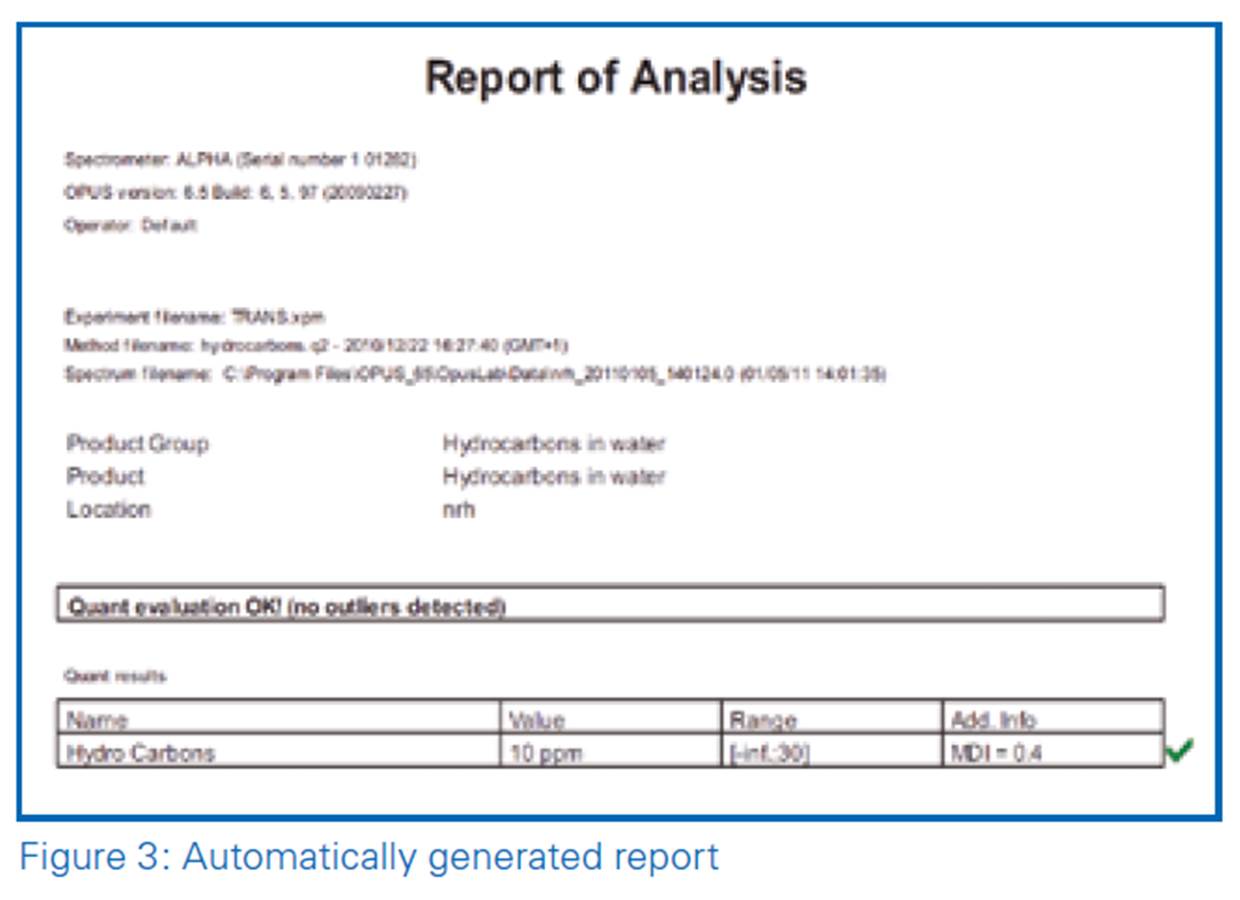
When the sample is filled into the flow through cell simply press “Measure”, the measurement will take about 20 seconds. When done, the report is automatically generated as a PDF and can be printed:
Once a day a background measurement against air is required.
Details on the measurement evaluation
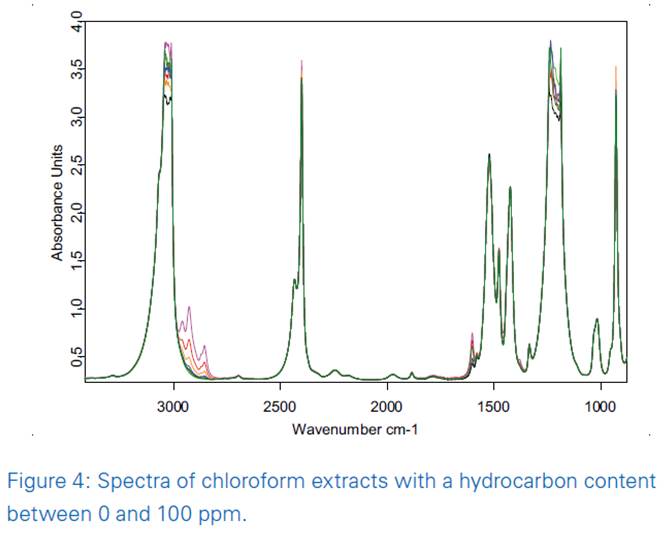
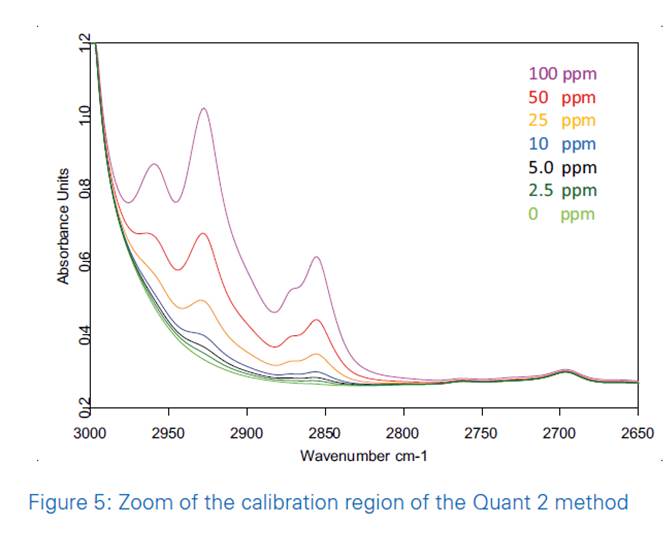
Figure 4 shows various samples with different amounts of petroleum hydrocarbons in chloroform. All spectra contain similar spectral features that originate from the chloroform spectrum. The differences due to the varying content of petroleum hydrocarbons are noticeable in the region below 3000 cm-1 where the vibrations of aliphatic C-H bonds are located. The region between 3000 and 2820 cm-1 is therefore used for the multivariate calibration. The enlarged version of this region can be seen in figure 5. Figure 6 shows the ppm values of reference samples predicted by the calibration model.
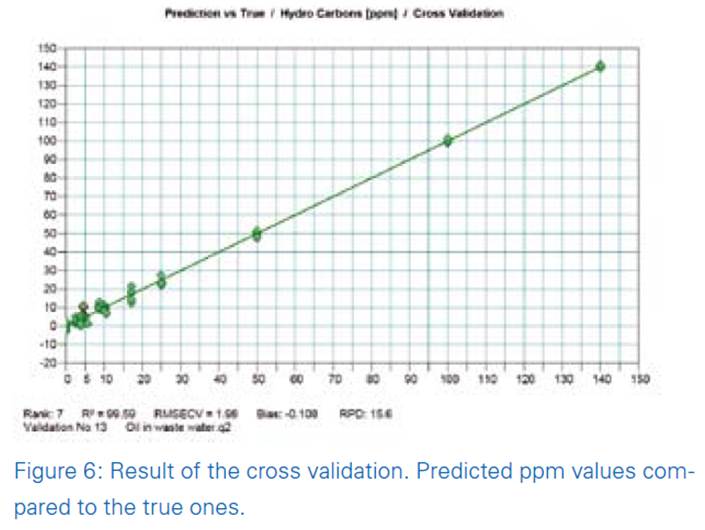
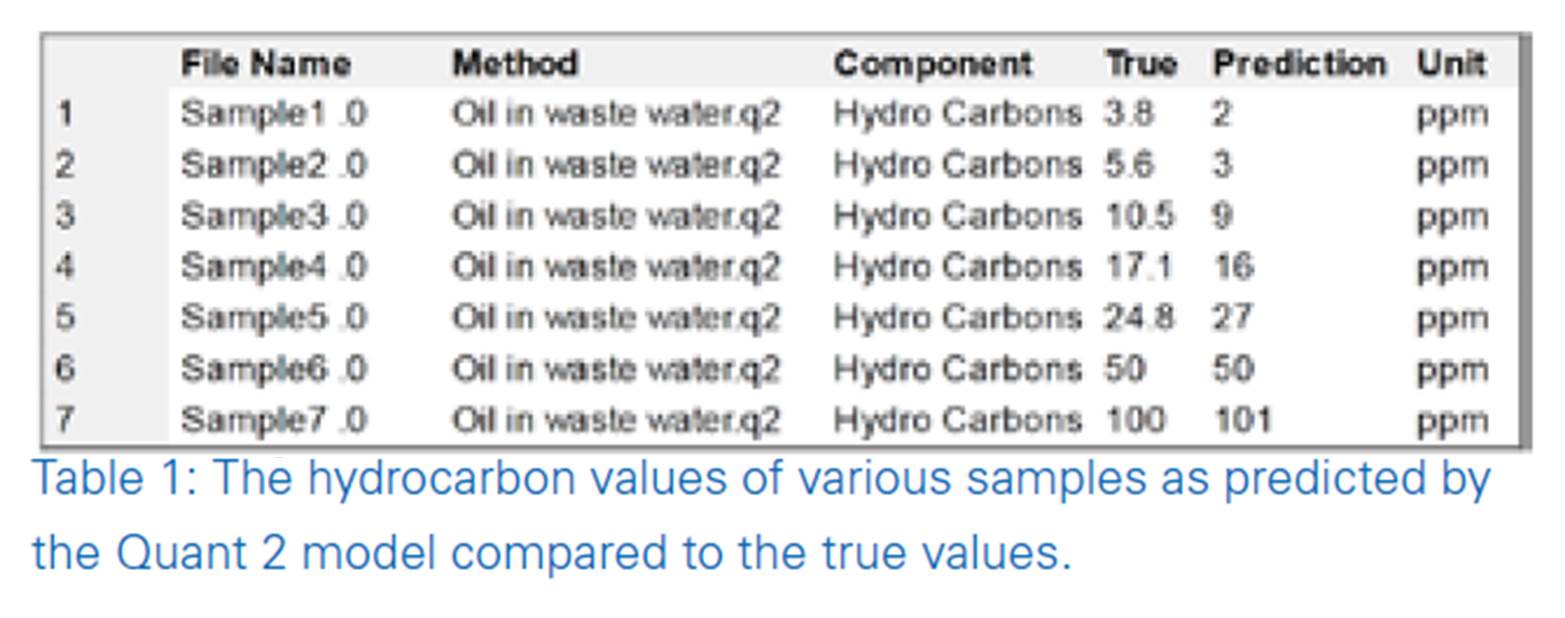
These values are plotted against the true hydrocarbon content measured with the GC-method. The chart is the result of an internal cross validation where one spectrum is taken out of the calibration spectra set and its value is predicted by a model created out of the residual calibration spectra. This is done for each single spectrum out of the calibration spectra set. The predicted values are marked as green spots and the true value is indicated by the straight green line. The deviations of the predicted values are very small; consequently the RMSECV (Root Mean Square Error of Cross Validation) is very low with a value of 1.98 ppm and the coefficient of correlation reaches 99.59 % external samples. The results of this test are listed in table 1. True and predicted values are in good agreement with each other; the deviation of the measurement values is in all cases less than 3 ppm. This error includes systematic and random errors resulting from sampling, the references and user differences.
Summary
By using the ALPHA spectrometer system with a specially designed flow through cell a fast and accurate analysis of the hydrocarbon content in waste water is possible directly on oil platforms. Due to a robust instrumental setup, simple sample preparation and a user friendly measurement procedure the analysis can even be performed by untrained users. The complete test takes less than 10 minutes and therefore is very appropriate to be used as a monitoring method for large sample numbers.
Credit : Bruker Co., Ltd.


|
|
|