

 |
 |
 |
FT-IR microscope the analysis of microparticles can be accomplished quickly and as a matter of routine.
Introduction
There are numerous fields of application where the analysis of micro-particles is of considerable interest. Microparticles can appear for instance as a contamination of products like pharmaceuticals and electronics or as an air pollutant. They can also be a product component in all kinds of formulations like cleaning agents or polymers. In cases that the particles cannot be obtained as bulk material or when they should be analyzed individually, FT-IR microscopy is a powerful technique to determine their chemical identity. With FT-IR microscopy it is possible to measure an IR-spectrum anywhere on the sample with a very high local resolution which makes it possible to analyze even complex multi-component particle compositions. In fact one single micro particle is enough for a chemical analysis, something that cannot be achieved by most of the common analytical techniques. Furthermore, the FT-IR measurement is non-destructive and other analytical techniques might be applied afterwards if applicable.
Instrumentation
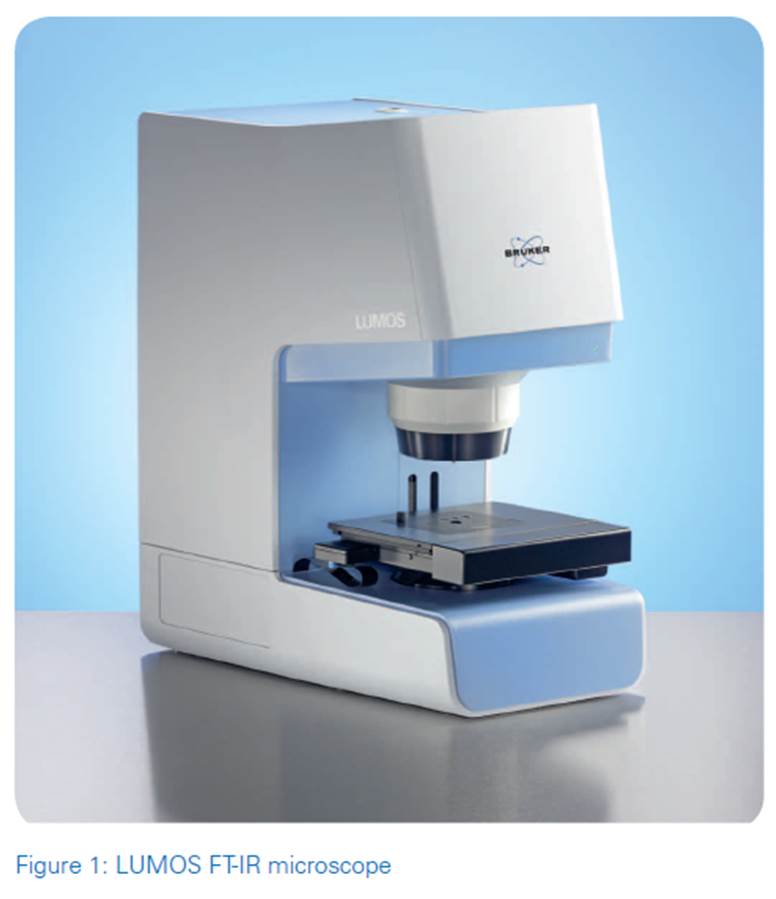
The FT-IR microscope LUMOS (fig. 1) is a standalone microscope with an integrated spectrometer. Due to the motorization of all moveable components inside the LUMOS, the system provides its high degree of automation. It is utilizing state-of-the-art optics for optimal sample visualization and infrared data collection. Its 8x objective provides the measurement modes ATR, transmission, reflection and high quality visual inspection capabilities. The innovative motorized Attenuated Total Reflectance (ATR) crystal allows performing the measurement procedure completely automated including background and sample measurements. In combination with a motorized stage, fully automated mappings can be performed in ATR, transmission and reflection.
Besides the automated hardware the software provides a very elegant wizard based operating concept. The user is guided through the whole measurement procedure by the dedicated OPUS Video-wizard, a user interface that always provides the appropriate functions for the current measurement step. Although the LUMOS is designed to be operated by non-experts for routine applications, its exceptional sensitivity makes it also very suitable for high demanding applications.
Example: Measurement of contaminants separated from a liquid pharmaceutical formulation
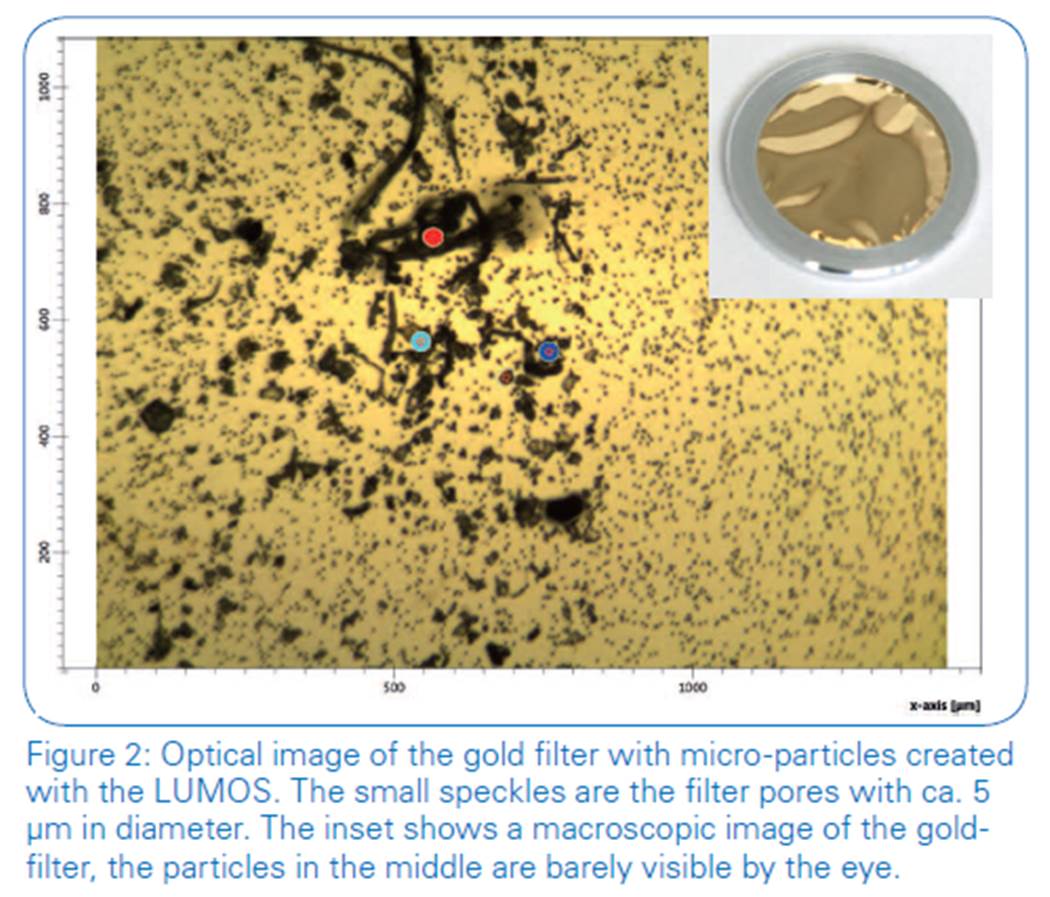
Pharmaceutical substances need to be as pure as possible and even traces of a contamination need to be thoroughly examined in order to find and remove the origin of the impurities. In our example the contamination was filtered out of a pharmaceutical sample by using a gold-filter with a pore size of about 5 μm (see inset, fig. 2). After drying the filtration residue was examined directly on the gold coated substrate with the LUMOS FT-IR microscope (see fig. 2). The small dots that can be seen predominantly on the right side of the image are the filter pores, the black particles and fibers are the filtration residue. Sample analysis by using ATR was performed at three sports marked in red, blue and light-blue. The measurements were performed with the automatic knife-edge aperture set to 10 x 10 μm using the ATR-mode with an acquisition time of 20 seconds/spectrum and at a spectral resolution of 4 cm-1. The result spectra are shown in fig. 3 with colors according to the measurement positions.
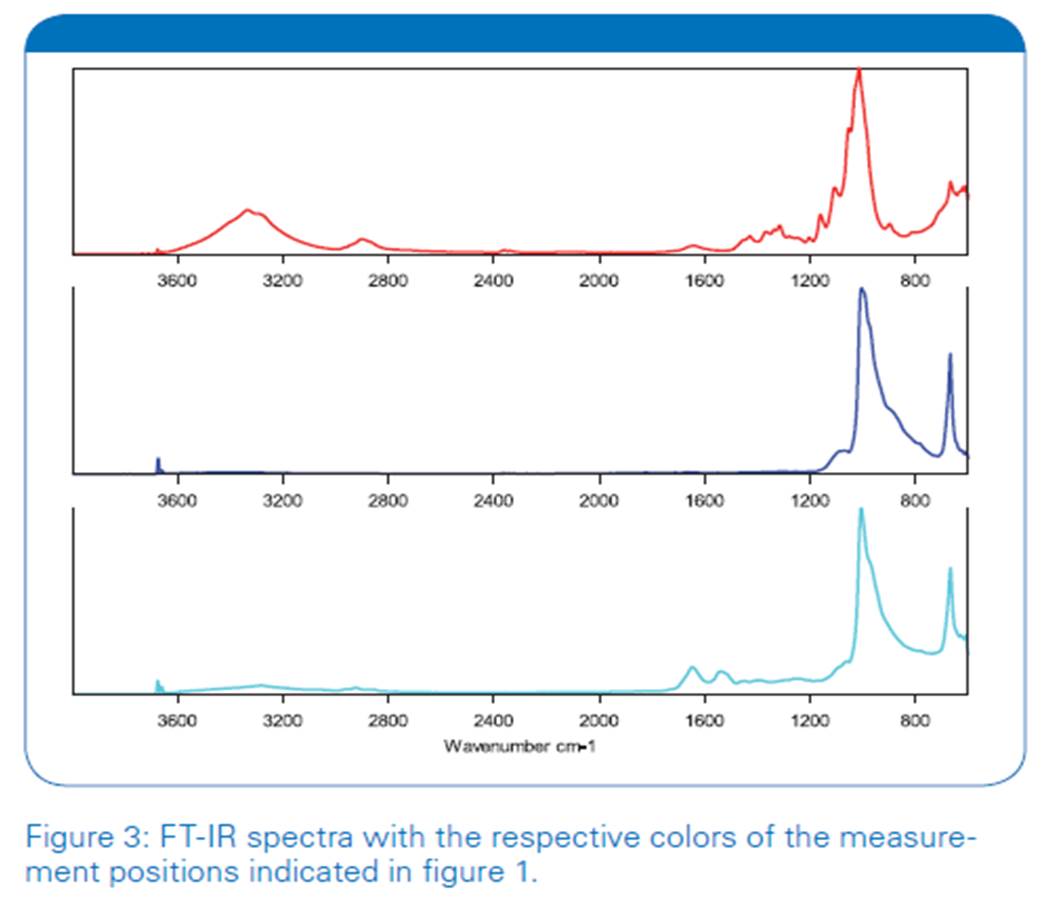
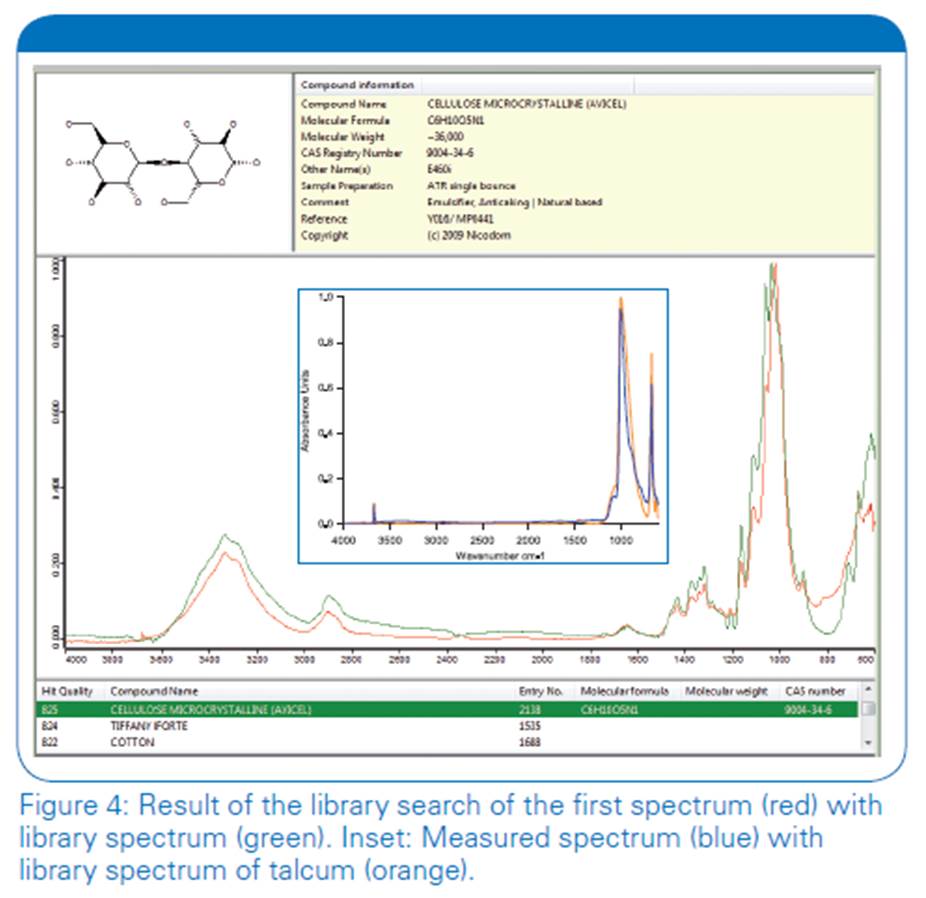
The measurements clearly show that the sample is not as uniform as the visual image pretends. The first two spectra show distinct differences. Using the library search, the first spectrum can be clearly identified as cellulose and the second one as talcum. Both spectra are shown together with the respective library spectra in figure 4, the hit qualities were in both cases close to the ideal value of 1000. The third spectrum is very similar to the second with two additional bands around 1600 cm-1 that are typical for amides. The main component of the third spectrum is, when compared to the second one, obviously talcum. The additional amide bands are likely stemming from a polymer like polyamide or wool. With this information it is now much easier to locate the source of the contamination.
Example: Defect micro-particle in multilayer structure.
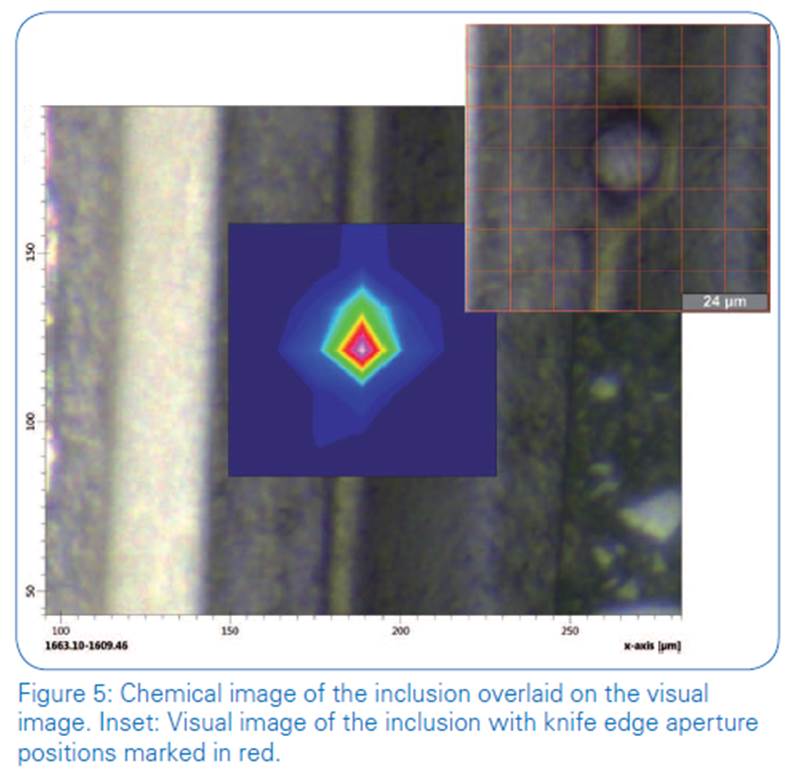
Our second example deals with a micro-particle inclusion in a multilayer acrylic varnish structure. The inclusion has a diameter of about 22 μm and is hard to distinguish from the matrix material in the visual image (see inset of fig. 5). In order to visualize the particle and to gather information about its chemical nature a mapping of the inclusion was performed with a 7x7 measurement-grid, each grid cell with an individual aperture of 12x12 μm (see inset of fig. 5, red lines). The IR-spectrum of the particle has a pronounced double band at 1650 and 1550 cm-1 that is not present in the surrounding matrix. It´s chemical image that is shown in fig. 5 was created by integration of the characteristic band of the inclusion. It shows a much higher contrast between the inclusion and the surrounding matrix than the visual image.

In order to reveal the chemical nature of the inclusion a library search was performed on the spectrum located in the center. The search result is shown in figure 6 and clearly shows that the particle consists of polyamide.
Summary
With the FT-IR microscope LUMOS the analysis of microparticles can be accomplished quickly and as a matter of routine. The built in fully motorized ATR objective is the ideal tool for the analysis of microscopic samples with a high lateral resolution and an outstanding surface sensitivity. It allows the IR-microscopic measurement of almost all types of different particles. In combination with the built in library search function of the included spectroscopic software OPUS it is possible to quickly identify even unknown samples. Chemical imaging makes it possible to visualize and analyze larger areas. Its comfortable use and its high performance make the LUMOS an ideal instrument for the visualization and analysis of micro-particles.
Credit : Bruker Co., Ltd.


|
|
|